Monitoring Java Applications on Azure with Application Insights
Monitoring of an application helps us to track aspects like resource usage, availability, performance and functionality. Azure Monitor is a service available in Microsoft Azure that delivers a comprehensive solution for collecting, analyzing, and acting on telemetry data from our environments.
Application Insights is an extension of Azure Monitor that provides Application Performance Monitoring both proactively and reactively. Today I’m going to tell you how you can easily use Azure Application Insights to monitor Java applications.
Please note that I have used WSO2 Identity Server in this article to demonstrate how to enable and configure Azure Application Insights for a Java Application.
Prerequisites
- Java application (using Java 8+)
- Azure subscription
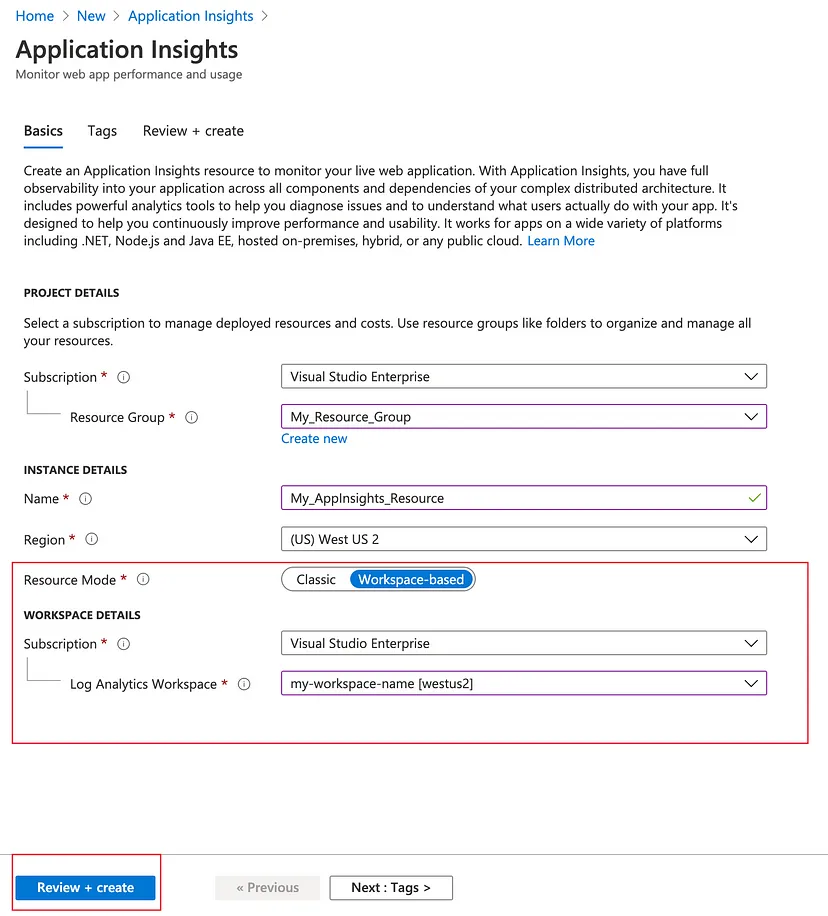
- As the first step, we need to create an Application Insights resource in Azure as follows. You can find how to create an Application Insights resource from here.

- Next, we need to copy the connection string from the Application Insights resource we just created as shown below.

- Create a file named applicationinsights.json with the following content. You should replace
<CONNECTION_STRING>by the connection string copied above.
{
  "connectionString": "<CONNECTION_STRING>"
}
-
Next, download the Application Insights agent for Java from here. You should keep the applicationinsights-agent-x.x.x.jar file in the same directory as the applicationinsights.json file created above.
-
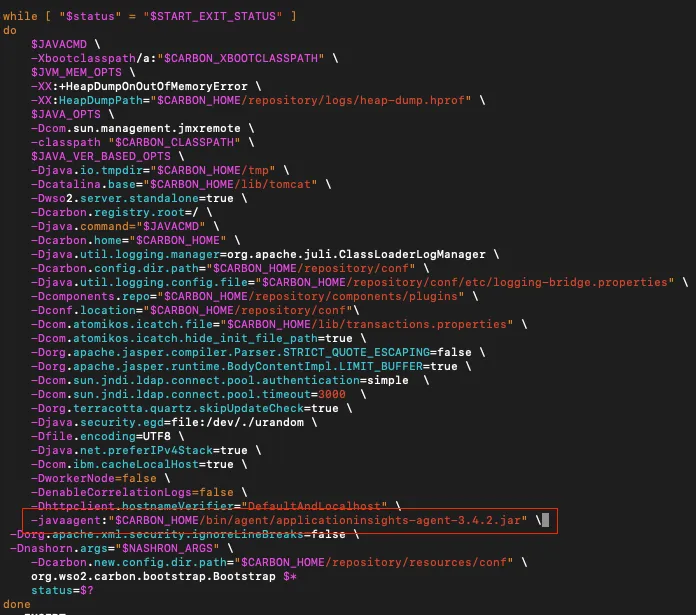
In our Java application, we should add a JVM argument as shown to point the JVM to the agent jar file. You need to update the path to the agent jar file.
-javaagent:"path/to/applicationinsights-agent-x.x.x.jar"
In my WSO2 Identity Server configuration, I have added the JVM argument in the

- When the Azure Application Insights is correctly configured for the Java application, it can be observed in the logs as shown when the application is started.

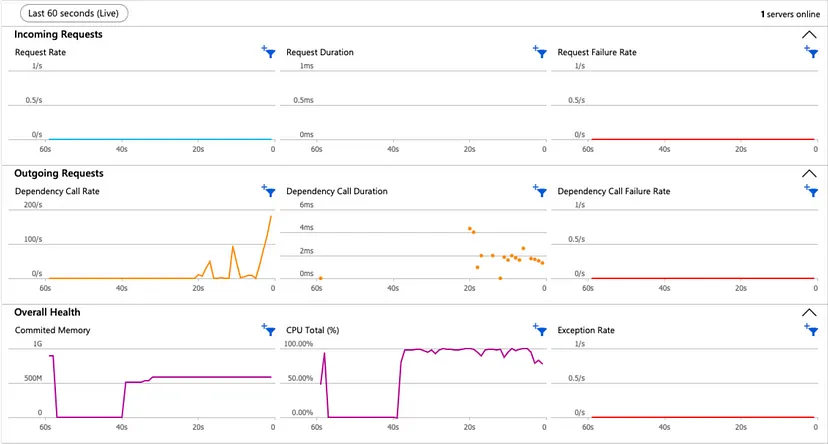
Now we can observe real time telemetry data from our Java application running on Azure through the Application Insights resource.

We can get information like CPU percentage, committed memory, request duration and request failure rate from Application Insights under Live Metrics.
Additionally, we can use features like Log Analytics, Availability tests and Alerting through Azure Application Insights. You can read more about Application Insights here.
Thank you for taking the time to read. Have a nice day!